
Are you ready to master all the performance indicators essential to the success of your lead generation campaigns? Why is this so important?
You have already asked yourself these types of questions …
- How can I correctly measure the performance of my business?
- What are the most important digital indicators to monitor?
- How can I properly monitor my prospecting activity?
- Is this applicable to social selling on LinkedIn?
In short… What are the most important metrics for your B2B business and how to calculate them?
This is what we will see today in this article dedicated to KPIs , their application to social selling and lead generation, let’s go!
What is a “KPI”?
KPIs (key performance indicators) are the elements that measure the performance of your business and its growth. What sets KPIs apart from the rest of the business metrics is that KPIs are the key metrics that will have the most impact on how your business grows.
By defining and analyzing them, your company will be able to:
- Measure the progress and success of each department
- Evaluate the strategies in place
- Get more leads
- Improve sales processes
Without these measurements, it’s a bit like walking through a thick fog, not knowing in which direction your energy was best invested! We will talk about :
- Lifetime Value (” LTV “)
- Customer retention and opt-out (” Churn “)
- Return on investment (” ROI “)
- Customer acquisition cost (” CPA “)
Not to mention our bonus at the end of the article. 🤫
Before we get into these metrics, let’s take a step back and cover the basics.
Use of your “first-party” data
“ First party ” data, also known as 1P data, is information that you collect directly from your customers or audience.
This is actually the most valuable data for your business, so why not use it, right?
This data is completely profitable since it is free for you, unlike secondary or third-party data , which is sold to companies that need it.
This data often includes:
- Data from behavior and actions is taken on your website or app.
- Data stored in your CRM (e.g. information on prospects and customers, surveys, notes, etc.)
- Subscription data
Organizing and taking control of ” first-party ” data should be a priority for any company wishing to deepen the relationship with prospects / customers, and above all to develop its activity.
Any business that doesn’t collect and use its first-party data to make decisions for future actions is wasting time and resources.
Once you’ve organized your data , integrated and tracked everything you can, a whole new world of KPIs metrics will open up to you.
Thus, you will know exactly what to do to grow your business with effective lead generation .
What are “conversions”?
Conversion is an activity that occurs when a prospect achieves a desired goal on your website, such as starting a subscription or downloading an ebook.
Conversions are generally divided into two types:
- ” Soft ” conversions: filling out a form, demo, webinar or registering for an application, and start of the free trial
- ” Hard ” conversions: purchase, subscription, or any paid conversion
Of course, the most relevant but also the most difficult conversion is the last conversion, hence the name.
Overall, you need to decide what a conversion is for each sales or marketing activity and what type of conversion you want to track.
This brings us back to our first point: Track every “ first party ” data item you can. If you haven’t already, Google Analytics and Google Tag Manager could become your best friends …
And when doing cold prospecting on LinkedIn, conversion tracking is just as important.
To clarify, if, for example, your conversions are the number of booked appointments or LinkedIn posts and email replies , you can track them in your CRM or sales management tool to establish the effectiveness of your prospecting.
The essential / basic KPI: The conversion rate
When you know what conversion is and how to track it, then you can calculate your conversion rate for a given time period and sales or marketing activity.

Example:
If, as part of your cold prospecting efforts, you contacted 500 prospects, and 25 of them were converted, the calculation will be as follows:
Conversion rate = (25/500) x 100 = 5 %.
But conversion is seldom of single origin, which is why it is essential to follow the path that leads to conversion as well.
For example, the prospect can see your ad, then come to your website, download an eBook. Then they can see your email or LinkedIn prospecting campaign, come back to sign up and create an account, which triggers a “ conversion event ”.
If you don’t follow your marketing and sales channels, you won’t really know where that lead came from …
Spoiler : It might sound complicated at the scale of global marketing campaigns, but it doesn’t have to be the case with LinkedIn prospecting . ! 😉
Now that we have the basics, let’s move on to essential KPIs for your business!
Return on investment – ROI
Return on investment, or ROI, is the measure of the profitability of your investment in a business, product or service. It can be used in different areas of your business …
How to calculate the ROI:
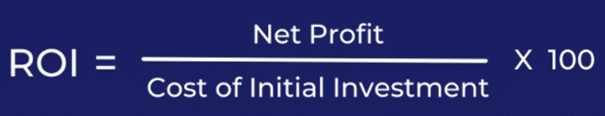
Example:
If you use a sales engagement platform like LeadIn , your monthly subscription is $97. If, by using it, you register 10 “hard” conversions in a month with a sale of 100 € each, you will obtain the following calculation:
ROI = (10 x 100 € / 97 €) x 100 = 1030 %.
Then…
Why is it so important to know your metrics?
The main advantage of this KPI is that it reflects a clear indication of how your business is performing across industries, what is profitable, what is not , and what you need to change to move on. on the upper scale.
Customer Lifetime Value – LTV (“LifeTime Value”)
Customer lifetime value indicates the customer’s total value to a business over the life of the trade. And it is essential to measure the profitability of the efforts made in the development of any business.
How to calculate the LTV:

Example:
You have a business that provides a subscription service for $ 20 per month. If you want to calculate how much value you’ll get from a customer over a three-year period, here’s how:
LTV = € 20 x 12 (number of subscriptions renewed per year) x 3 (years) = € 720.
Why is this indicator important?
This KPI helps you understand who your most valuable customers are and recognize new patterns or changes in the way customers make a purchase and interact with the business.
On the business side, if you know your average LTV , you can easily understand what your most profitable KPI (Ideal Customer Profile) is and more easily meet your sales goals by reaching the right audience.
In social selling for example, proper follow-up will help you increase conversion and retention by creating hyper-personalized messages at the “pain points” of your prospects.
Customer retention and churn rate KPIs
As a relatively new measure, customer retention and termination rates have taken a turn extending increasingly beyond software companies.
These KPIs are now one of the most essential metrics of sales and customer success:
- Customer retention is the percentage of customers who remain active as users or buyers for a given period of time.
- The churn rate represents the rate of customers who have canceled their service or stopped buying products.
How to calculate customer termination rate:
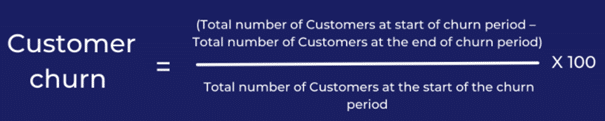
Example:
Let’s say you have 50 clients at the start of the first quarter and only 20 clients at the end. Here’s how you would calculate the churn rate and retention :
- Rate of ” churn “:
The difference between the number of customers at the start and at the end of the unsubscribe period: 50 – 20 = 30
The difference between the number of customers divided by the total number of customers at the start of the unsubscribe period, ie a “churn” rate of: 30/50 * 100 = 60%
- Retention rate:
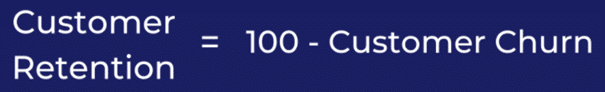
Or in this example: 100 – 33 = 67%
But why are these indicators important?
The main benefit of these KPIs is to see the exit or growth of customers within a certain period of time. With companies’ efforts to maximize Customer Lifetime ( LTV ), retention / churn rate go hand in hand.
These KPIs are essential in helping you determine customer satisfaction and retention rates. They are also for cash management and projection purposes!
Customer acquisition cost – CPA / CAC
The CPA / CAC is a measure that helps you determine the cost of acquiring new customers through your marketing and sales actions. The weaker it is, the better!
It just means that you spent less money to get a “hard” conversion and gain new customers .
Calculate the Cost of Acquisition of a Client:

Example:
Let’s say you invested $ 1,500 in the acquisition with advertising in a month, and the total number of conversions is 50 . The calculation would be:
Customer acquisition cost = 1500/50 = € 30 per acquisition.
Now consider this approach:
Imagine that you are using a tool for your lead generation whose approximate price is $ 100 per month.
Let’s say over the same time period, with your personalized and automated prospecting , you also got 30 conversions . The calculation would therefore be as follows:
Customer acquisition cost = 100/30 = € 3.33 per acquisition.
… a rather incredible difference between the two models isn’t it? As much to say to you that in the last option, it is directly the margin which increases. 🥳️
Yet we can assure you that many companies still prefer to invest “haphazardly” on expensive advertising campaigns, rather than using the best lead generation strategies on LinkedIn …
Why is this important?
Measuring the cost of acquisition allows you to optimize each sales and marketing activity to determine which ones are worth optimizing or eliminating.
In other words, it improves return on investment , profitability and margin .
summary
Of course, tracking and analyzing KPIs is no easy task, but we hope we’ve given you enough information to get started.
Remember to set up the tracking of your ” first party ” data and determine what your conversions are.
Whether these come from your favorite automated LinkedIn and email prospecting tool, or from your advertising campaigns, you MUST know your acquisition costs!
Test different acquisition channels (remember to A / B test each strategy well ) to find what works best for your business.
Only then will you be able to calculate your KPIs and better understand the overall performance of your business …
Spoiler: in B2B, very often you will not find a better acquisition cost than with the automation of your prospecting! To learn more, here is for example a complete guide on 3 things you must implement / automate on LinkedIn in 2022 to maximize your conversion rates! 😎
Finally, to recap, here is a simple table with all the formulas.
Conversion rate (CR) | CR =[Nombre de conversions / Nombre total de prospects ayant interagi durant la même période] x 100 |
Return on investment (ROI) | ROI =[Bénéfice net / Coût de l’investissement initial] x 100 |
Lifetime Value (LTV) | LTV = Average product / service value × Number of orders / subscriptions × Retention time |
Churn rate vs. Retention rate | Churn rate =[Nombre total de clients à la fin de la période de résiliation – Nombre total de clients au début de la période de résiliation] / Total number of customers at the start of the termination period X 100 Customer loyalty = 100 – churn rate |
Cost Per Acquisition / Cost of Customer Acquisition (CPA / CAC) | CPA / CAC = Total marketing or sales spend / Total number of conversions |
Don’t forget … you want to maximize your communication efforts and get the most out of LinkedIn and email multi-channel prospecting?
Book a demo call with us and / or get started free for 14 days with LeadIn .
It’s your turn ! 👋
You may also be interested in these articles
- Our high converting inmail templates
- How do I connect with someone on LinkedIn?
- How to use social proof in LinkedIn prospecting?
- How to launch your first prospecting campaign?
- Our ultimate guide to managing your LinkedIn inbox
- How to apply the AIDA model to prospecting on LinkedIn?
- Our Best LinkedIn Connection Request Templates